Do different brands of tube sound different?
Part I
Yes? Well maybe not. Join me on my odyssey on what might be the biggest like-for-like comparison made ever with actual data.
Inspired by thread “Do different tubes have different tones”, or something like that, I decided to embark on my latest folly. Get a bunch of tubes , do some sound tests and capture selected electrical data with the fond, but probably unrealistic, hope that the sounds can be correlated with the measurements and that we can all be enlightened by the experience.
So without a fanfare, let’s meet the tubes I encountered…
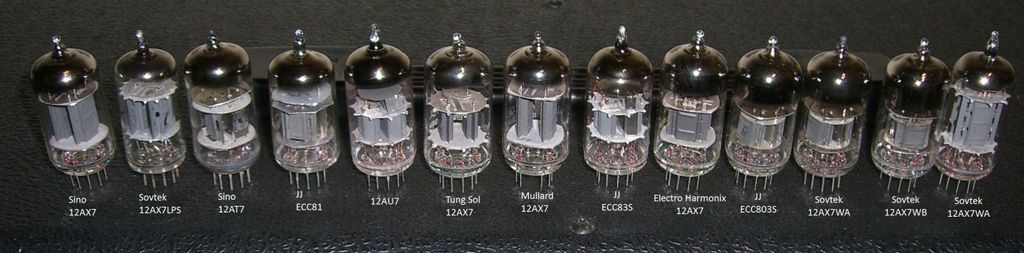
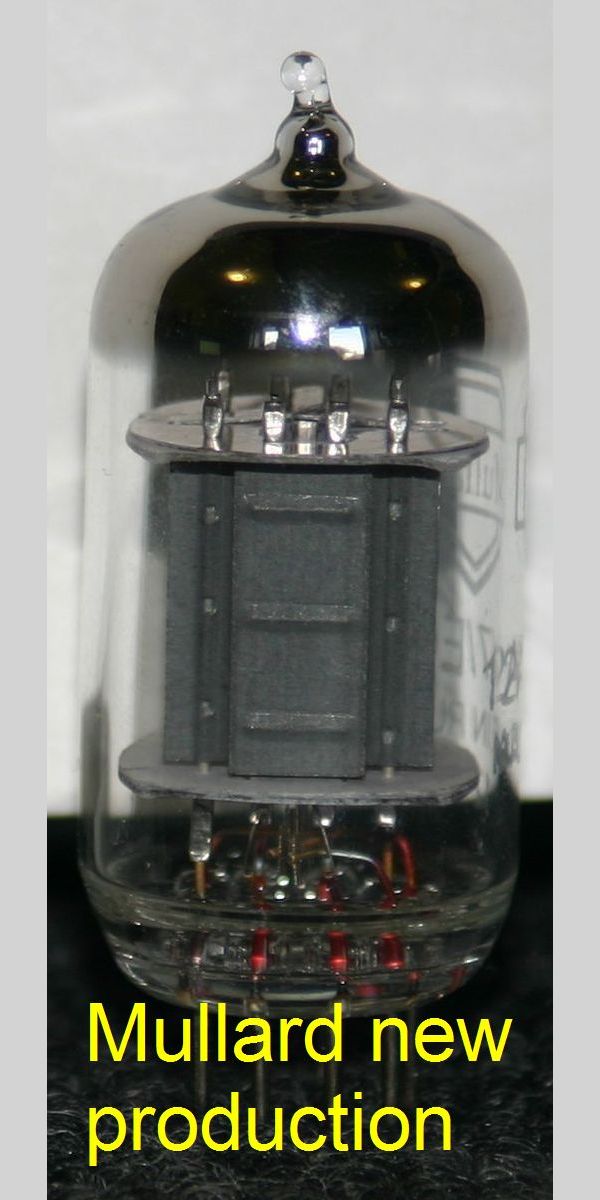
I picked a collection of new production 12AX7 type, but threw in a couple of other 12A*7 types just for interest. The reason for this choice is that I wanted to have information that would actually be useful to a wide population and the tubes they are likely to have access to. I certainly don’t have access to a bunch of NOS tubes and in any case it would blow away the tiny budget for this project. Needless to say, donations of NOS tubes for the project, especially your most precious, unusual and rare ones would be welcomed: For now, it’s just these preamp tubes . Power tubes may come later but will certainly require a lot more thought and effort.
Next the test amp, irreverently but affectionately named after its predecessor, the Fender Champ, meet “The Chump”.
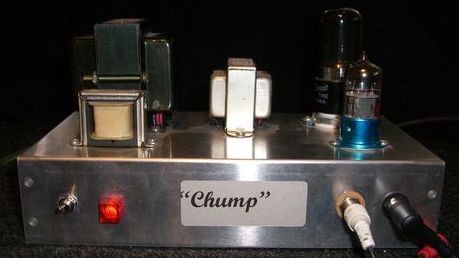
The stick-on label was a bit of a joke… Here is the schematic.

As you can see it’s a bare bones 6F6 based class A amp with a single preamp tube , no controls and no tone shaping to speak of. There didn’t seem be any benefit in making it any more complicated than necessary. It’s capable of about 2 watts clean although for this series of tests it’s nowhere near that as I’m trying to avoid too much coloration by the output stage. I chose to take the measurements from the main output as it seems that this is how anyone would use an amp in practice. The input comes from one channel of a 24 bit 48KHz sound card via an attenuator. The output goes to a dummy load, second attenuator and thence to the line in of the same sound card. I’ll ask that we don’t go into any great debate, at least at this juncture, on the topology of the test amp, as I don’t believe it’s germane to the discussion. It is what it is so let’s move on.
A note on noise and hum: I did what I felt was reasonable to minimize hum. I tried a hum bucking pot on the heaters but I wasn’t happy with the result. I could see 60Hz at about -48dB with pot at optimum so I changed to use a DC heater for the preamp tube . The arrangement was something of a kludge but effective as it took that hum down to -60dB, comparable with the noise floor. Don’t try to copy this – it will only work in this design. I also changed the grounding to break a loop between formed by the safety ground in both the test amp and the desktop PC.
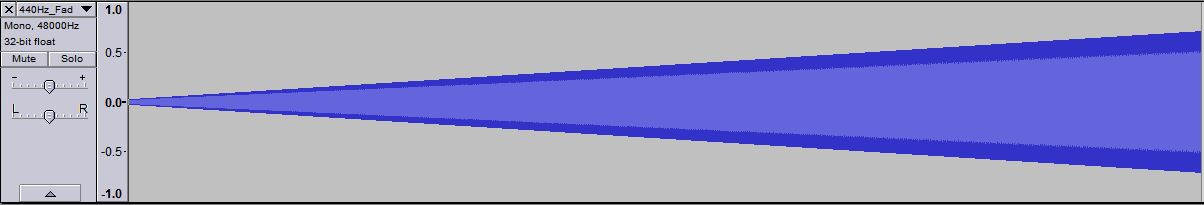
I used the software tools at my disposal, Adobe Audition, Audacity, and Right Mark Audio Analyser. I used Audition to create a test sequence consisting of a 10 second 440hz tone, 10 seconds of silence to check hum and noise, 10 seconds of ‘A” major tones to listen for intermodulation products, 10 second of silence for microphonics and finally a couple of different styles of guitar-heavy music clips. The microphonics test was done by stroking each tube with a short length of a twisted pair of PVC insulated wire.
Here is an mp3 version of this sample result just so you can hear it. This is not suitable for any testing due to the extreme compression loss. JJ-ECC803S.mp3

Method
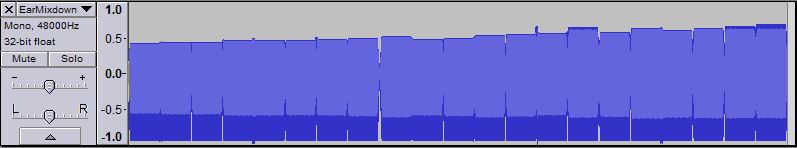
The test sequence was replayed through ‘The Chump’ and the results saved. Microsoft format 32 bit floating point PCM ‘wav’ format files were used for all the tests. The input level was changed in each test so each had the same output level as closely as I could, within <0.5dB. This was to make it easier to compare spectra and to keep the distortion introduced by the output stage constant. Using Audacity I selected the portion of the clip of interest to zoom in and measure amplitude and spectra. Audacity has the ability to export the spectrum as test which I could then import into Excel. The Audio Analyzer generates its own test signals and again input levels were adjusted for each test to give a constant output level.
Copies of results were saved in ‘flac’ format. Each test is about 5MB long. The zip of all the files in ‘flac’ format is over 100MB. There are also all the audio analyser results with their charts you can look at if you’ve a mind to do that. There is a single file with one clip played through all the test tubes one after another. That’s probably all you need to listen to. The links are at the end of this section. You’ll need to have a flac codec installed. If you want to look at the waveforms you could try Audacity and Right Mark Audio Analyser is handy for comparisons of techie type data.
Test 1 – Technical
I took DC volt measurements at the supply to the first stage and to both the first stage plates. The purpose was to check the basic operation of the tube to DC specs and to illustrate what happens if you replace a 12AX7 with say a 12AT7 without changing anything else. Using the Audio Analyzer I measured Frequency Response, Noise, THD and IMD.
Test 2 – Microphonics
I replayed the microphonics section and noted the peak value. I ignored any obviously anomalous peaks.
Test 3 Spectral Comparison
I plotted the spectra up to 5kHz on chart for all samples you The difference between tubes could be seen. Harmonics over 5Khz were lost in noise so there was no value in plotting them.
Test 4 Listening
The difference in noise level, hum characteristic and microphonics were obvious but the tone and music tests were much tougher I’m only one set of ears so this is where you can do your bit: download the audio files and you can rate the tubes for yourself.
Results
1) Spectra – 440Hz tone

The highest peak is the fundamental at 440Hz. You can see the higher harmonics to the right. The peaks on the left are hum at 60Hz and its harmonics. The frequency labels were removed as it was too cluttered.
2)Data & Scoring
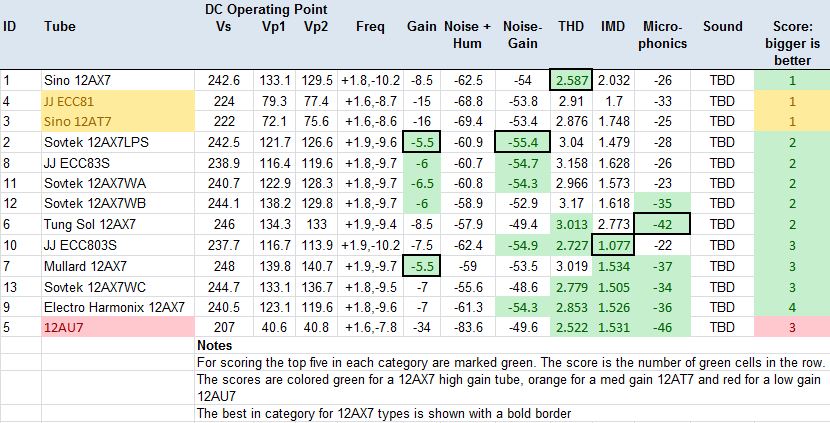
Note: the gain is really level – an indirect measurement of relative gain.
Discussion
The DC operating point was very similar for all tubes , despite the obvious difference in construction. Noise had a greater spread of about 6dB between tubes of the same type. Gain was better, with about a 3dB spread, or 1.5dB per gain stage, a very small number. There is almost no difference in frequency response. Microphonics is very different between tubes , both in level and character – some tubes sounded quite bassy and others jangley or brittle.
With the caveat that more tubes should be measured, the ranking is:
- By this scoring, the best tube overall is the Electro-Harmonics 12AX7.
- The best for THD is the Sino 12AX7, but wow does that filament glow bright for a second or so after switch on!
- If you want gain, go for a Sovtek 12AX7LPS or a Mullard 12AX7
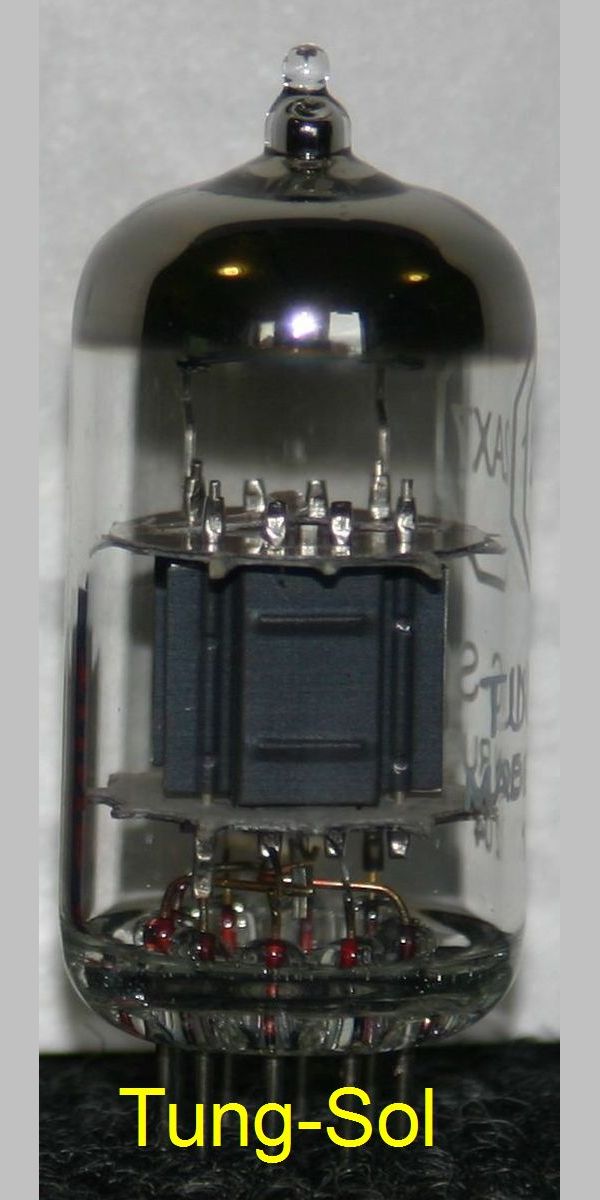
- For lowest microphonics, Tung Sol 12AX7
- If low IMD is your thing, buy a JJ ECC803S, just make sure the microphonics aren’t going to be a problem.
- For first stage use, where you want low noise and microphonics, pick an EH 12AX7.
Conclusion
I couldn’t reliably tell any difference between the music samples from different tubes . It seemed a little easier with the 440Hz tone but I couldn’t translate that into better or worse sounding. You can see from the spectral plots that the biggest difference in harmonics is at the high end. It is known that THD is not a good indicator of pleasant sounding and that it’s better to use a square weighting of harmonics. Perhaps we could go further and assign a greater weight to the dissonant harmonics. It’s easy to do the calculation but difficult to get the listening tests to correlate them. In the end the differences are small. For certain, I didn’t hear anything like the differences that are ascribed to these brands by the distributors or in folk lore on Internet sites. I saw terms like ‘rich’, ‘lush’, ‘musical tone’ and ‘detailed’. I believe I have demonstrated that most of these statements are inaccurate and misleading and that is likely a better correlation between the positive attributes lauded in the descriptions and the profit margin for the vendor. One site claimed ‘superb linearity’ for the Tung Sol when in fact it’s one of the worst. Again, I caution, most of the differences are tiny.
You also have to question which is more important, brand of tube or the circuit it’s used in? It has to be the circuit. On other words, the most sure fire way to change to sound is to change the circuit.
Anyway, you don’t have to take my word for it and I may well be applying my own biases. You can listen for yourself by downloading these lossless audio files and listening to them:
One music clip played through all tubes, one after the other. Try this first and see if you can tell the difference.
The Original Test Signal
Sino 12AX7 Test
Sovtek 12AXLPS Test
Sino 12AT7 Test
JJ ECC81 Test
12AU7 Test
Tung Sol 12AX7 Test
Mullard 12AX7 Test
JJ ECC83S Test
Electro Harmonix 12AX7 Test
JJ ECC803S Test
Sovtek 12AXWA Test
Sovtek 12AXWB Test
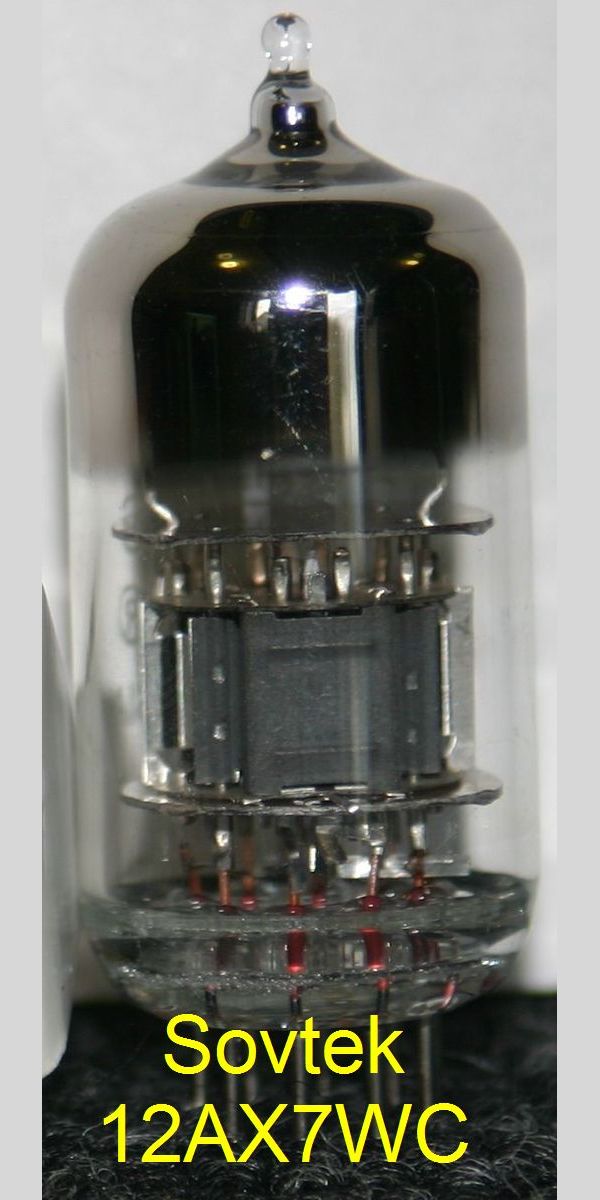
Sovtek 12AXWC Test
A zip of all the test results HUGE!
Do different brands of tube sound different?
Part II
No? Well maybe they do. Join me as the trip takes a wild turn in part II..
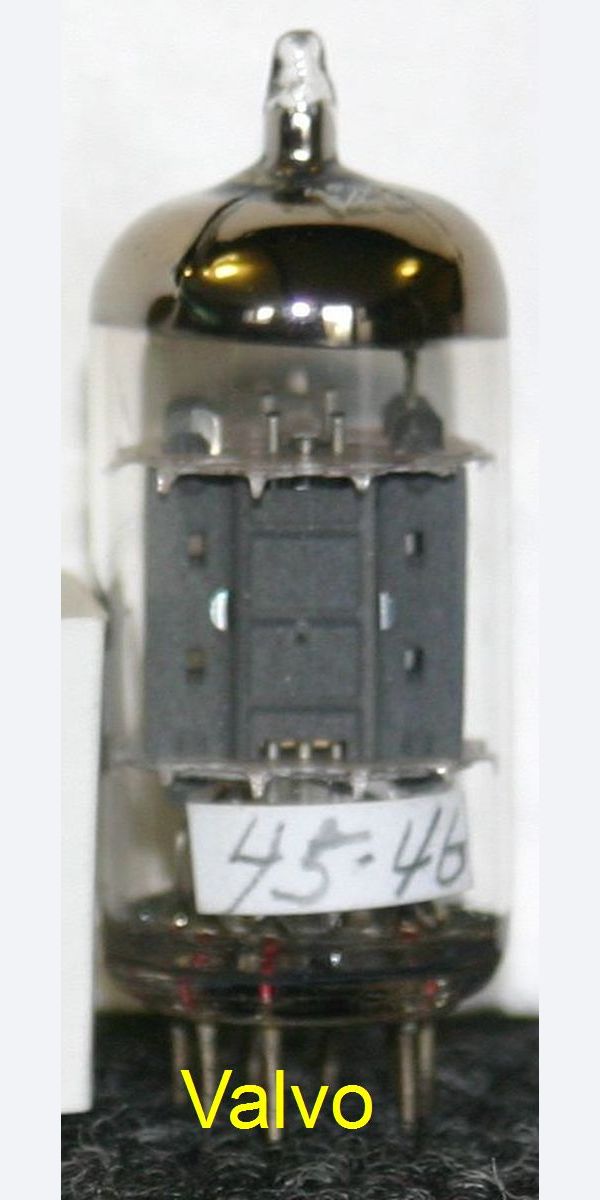
I’d been meaning to take this whole thing to the next level and do some tests that would, at least in some way, give an indication of performance when driven hard, all the way into serious clipping. The first thing I did was to get some more tubes for my collection. Since the budget didn’t stretch to NOS tubes and because not one single person donated any of their precious goodies to this project (can you believe it?) I had to go cheap. I bought used “Good Old Stock” tubes . I like to call them “tried and tested”. Now the big question was just to resolve the method. I thought about this for along time. Too long in fact as it’s been about two years since I did part one. I guess I was over thinking it and decided in the end that simple would do the job just fine.

Method
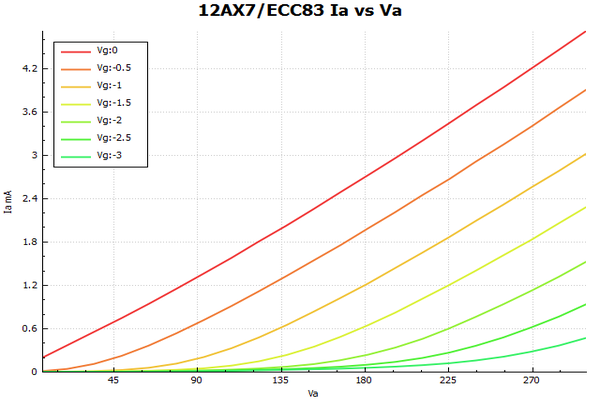
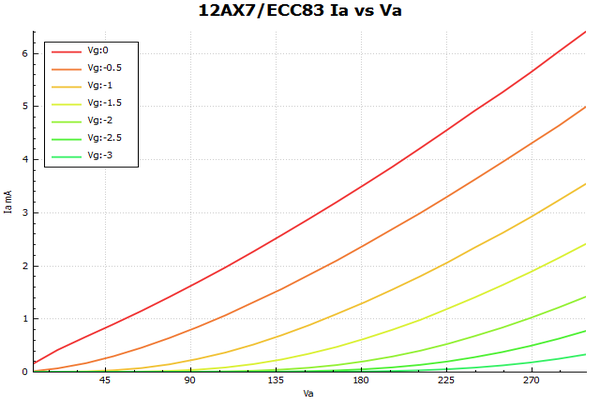
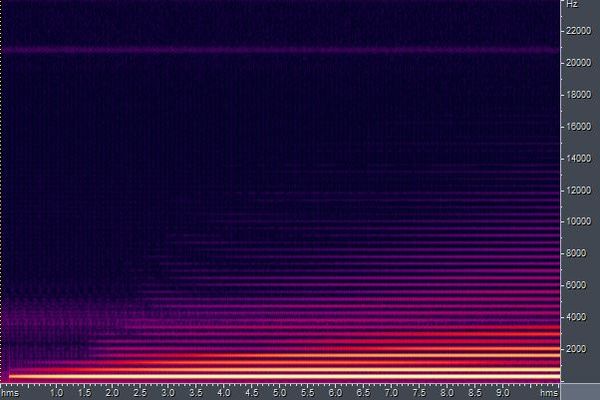
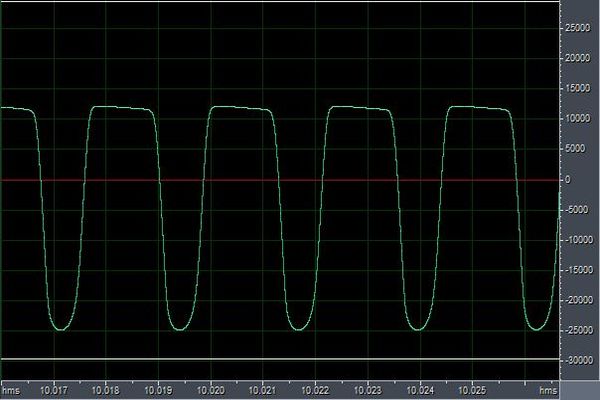
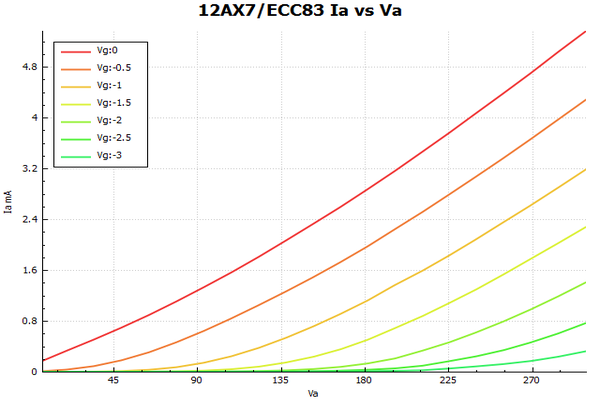
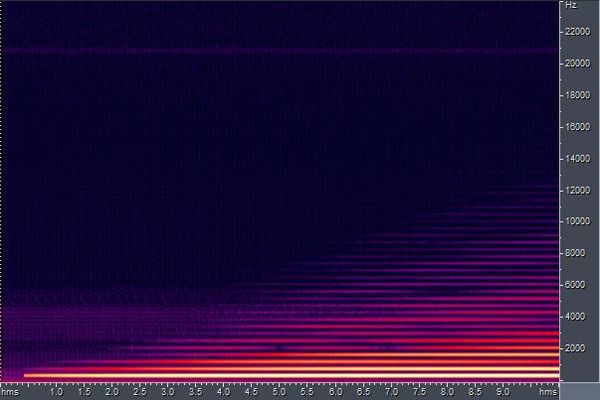
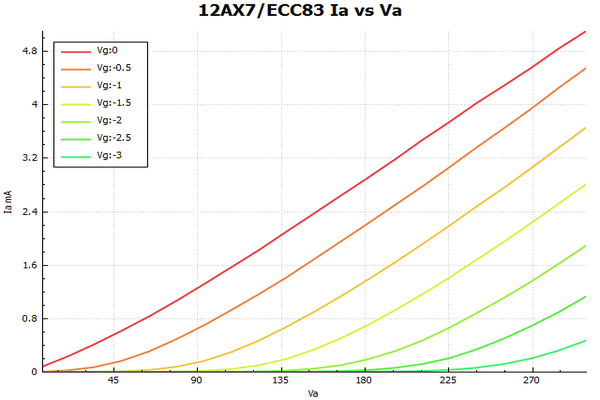
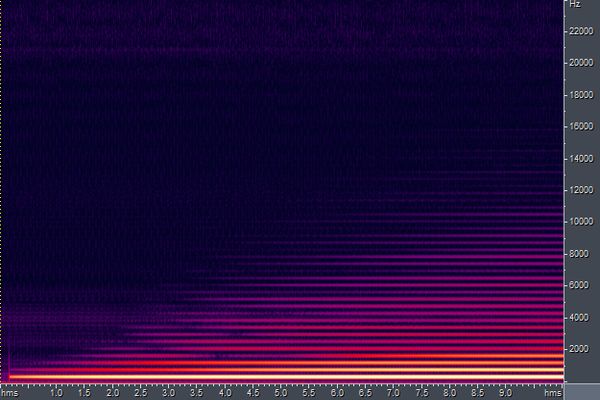
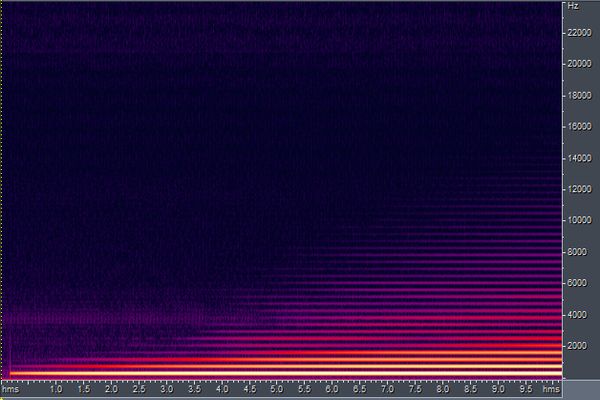
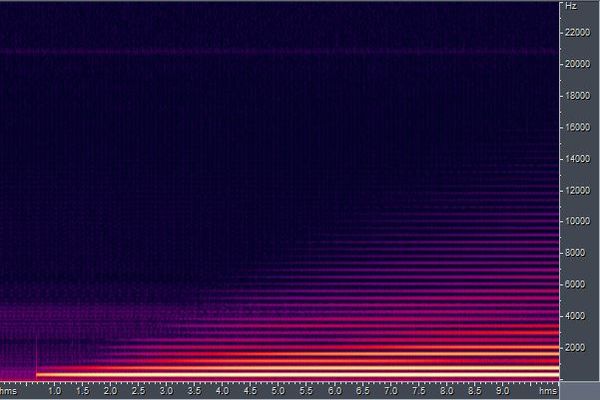
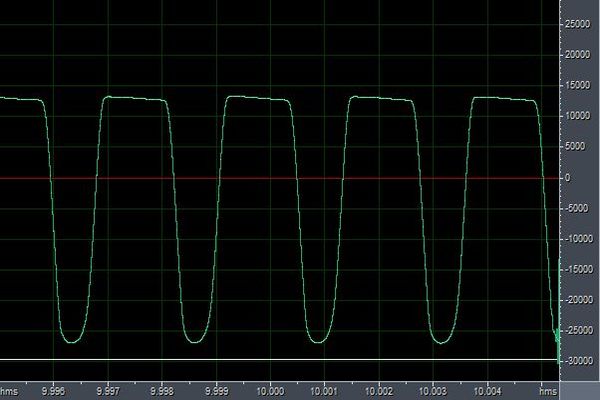
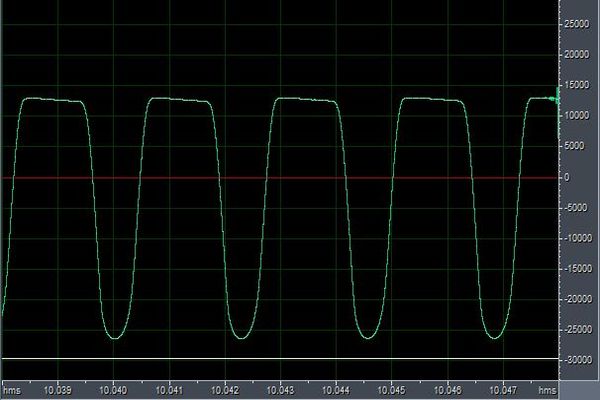
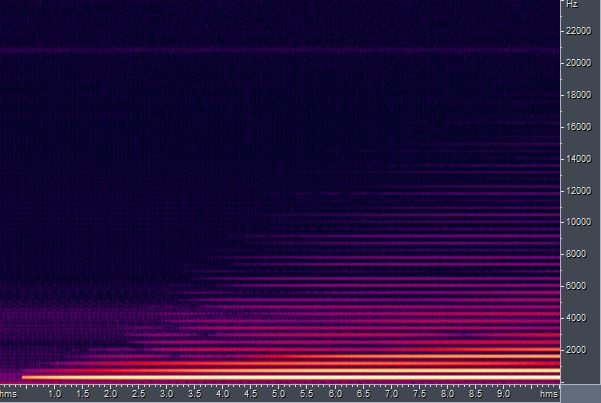
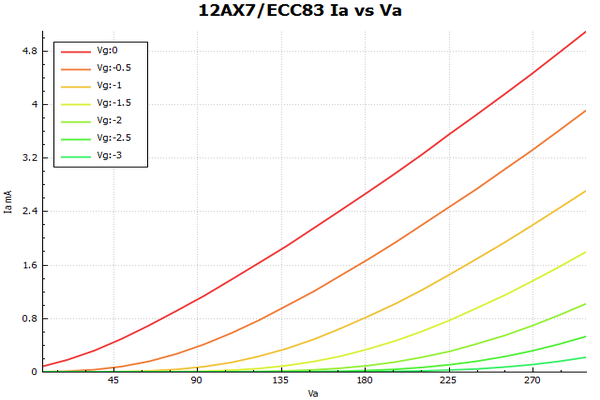
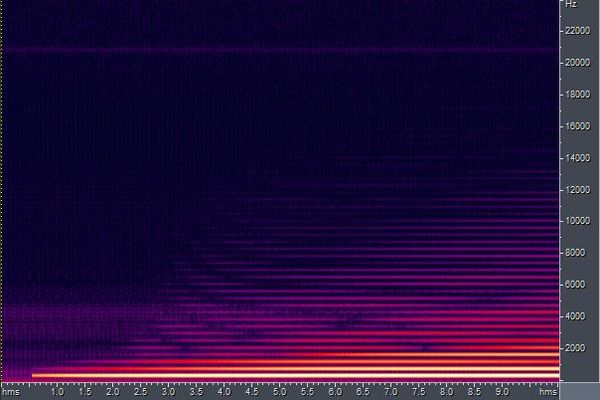
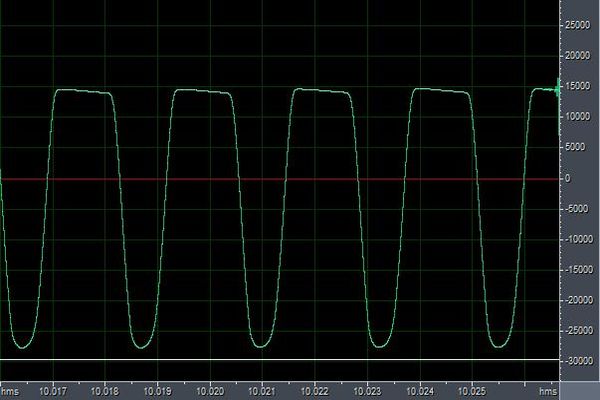
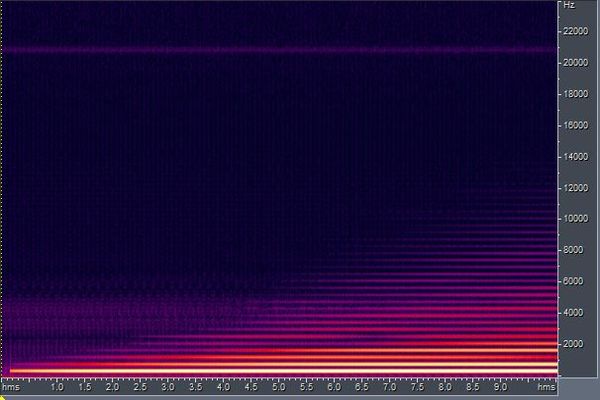
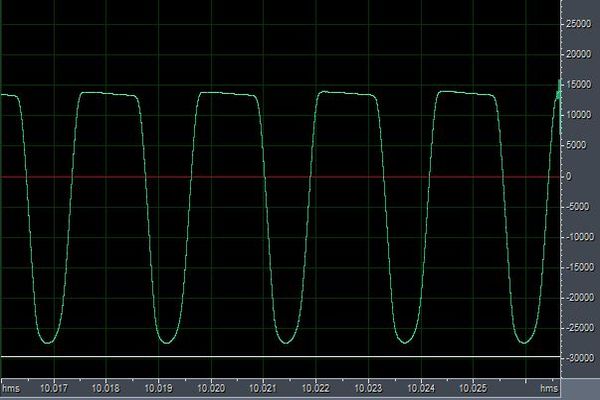
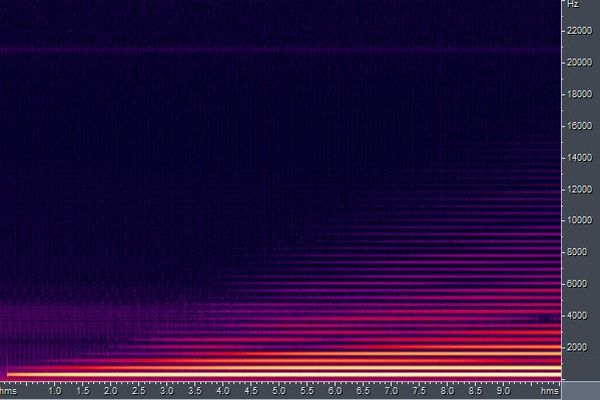
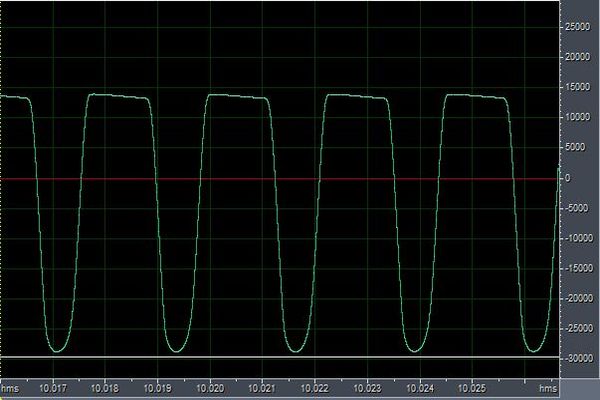
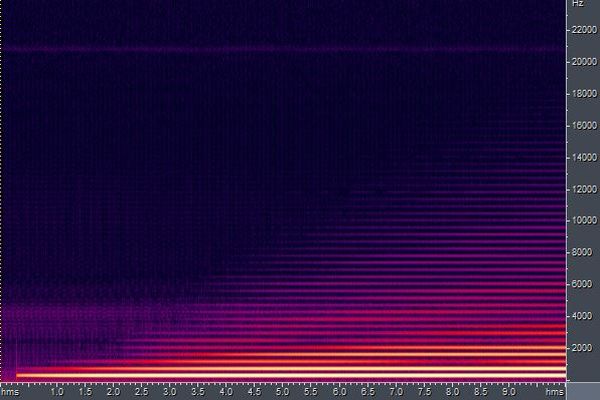
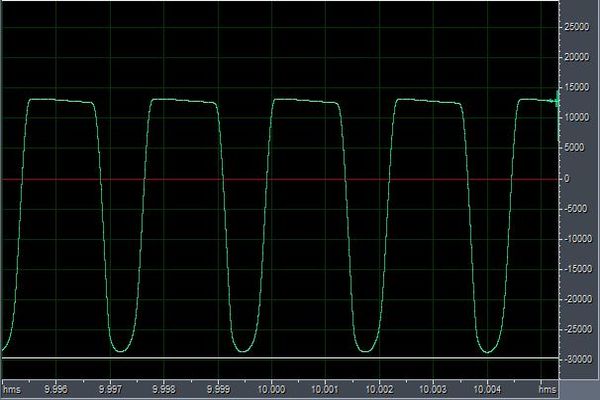
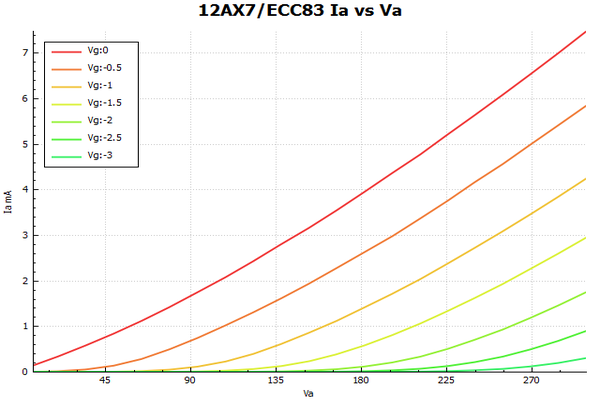
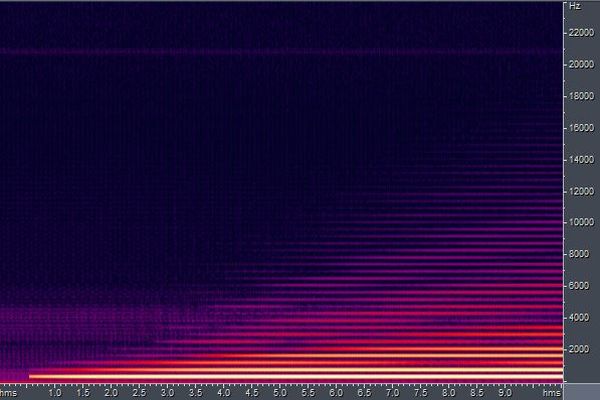
What I did for these tests was to modify the “Chump” amplifier to use more usual cathode and anode resistance values, typical of early Fender amps. To drive it I used a 440Hz tone that gradually increased in amplitude by a total 30dB over ten seconds. The amplitude was chosen to drive the second triode well into clipping. I applied this to the test amp and recorded the attenuated output from the second anode. I used Audacity to construct a spectrograph, i.e. frequency content versus time, and also the waveform when driven to the extremes of clipping. I also used a curve tracer to plot the Ia/Va curve. I repeated this for each tube .
The Data
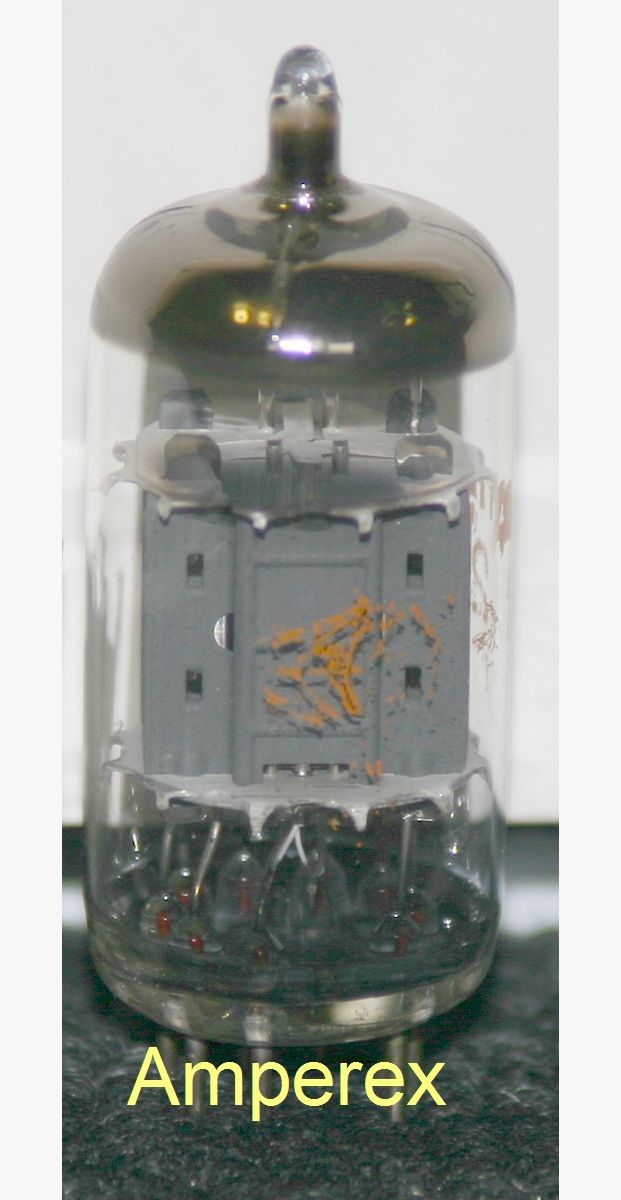
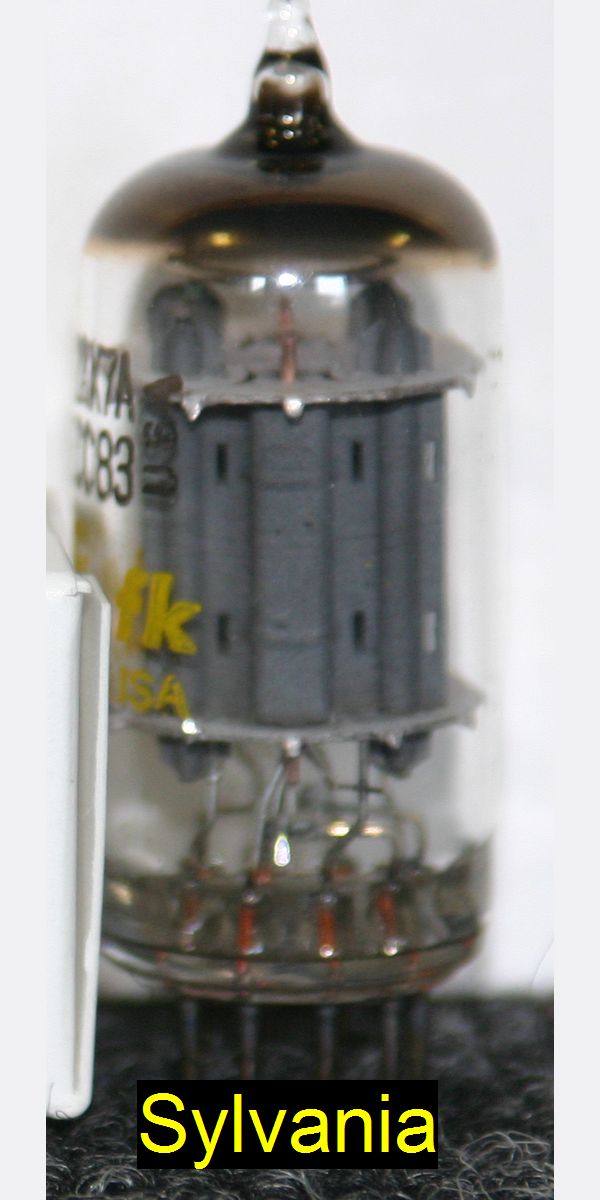
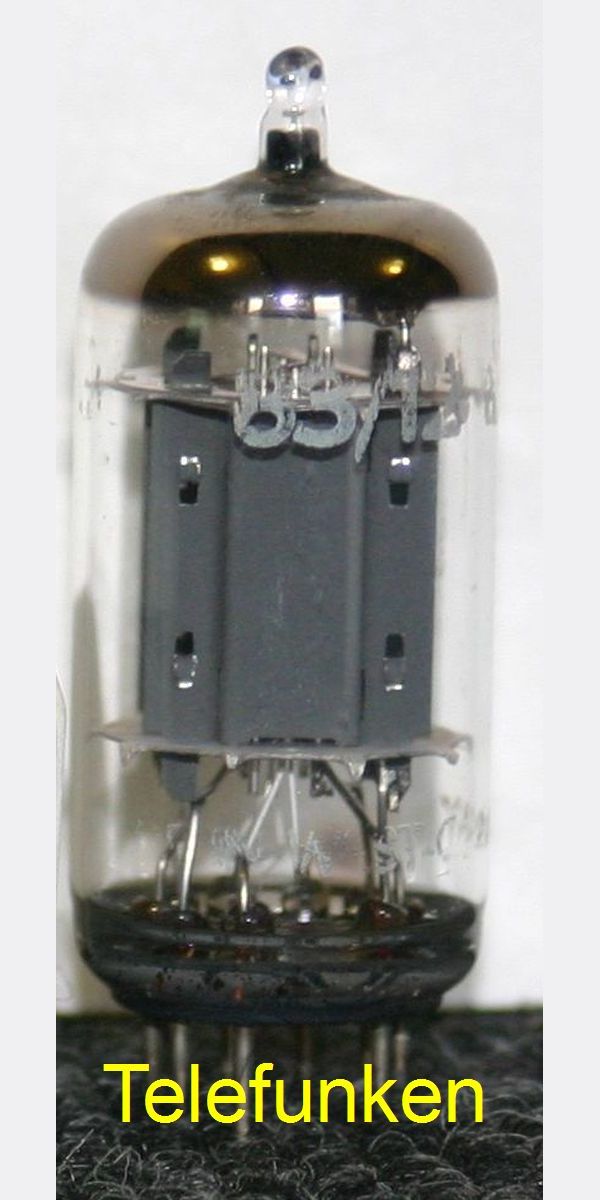
The test results for each case is shown in the table below. The results are sorted in order of increasing signal amplitude to make it easier to compare tubes of a similar gain. Notice that the construction of the tubes has considerable variation as does the gain.
NOTE: If you using Internet Explorer you will have to download the audio to hear it as IE does not support WAV files. WAV is needed as it is lossless. Just about any other browser will work.
| Tube Type | Spectrograph | Waveform | Ia/Va Curves |
 |
 |
 |
 |
 |
 |
 |
 |
 |
 |
 |
 |
 |
 |
 |
 |
 |
 |
 |
 |
 |
 |
 |
 |
 |
 |
 |
 |
 |
 |
 |
 |
 |
 |
 |
 |
 |
 |
 |
 |
 |
 |
 |
 |
 |
 |
 |
 |
 |
 |
 |
 |
 |
 |
 |
 |
 |
 |
 |
 |
 |
 |
 |
 |
 |
 |
 |
 |
 |
 |
 |
 |
 |
 |
 |
 |
 |
 |
 |
 |
 |
 |
 |
 |
Analysis
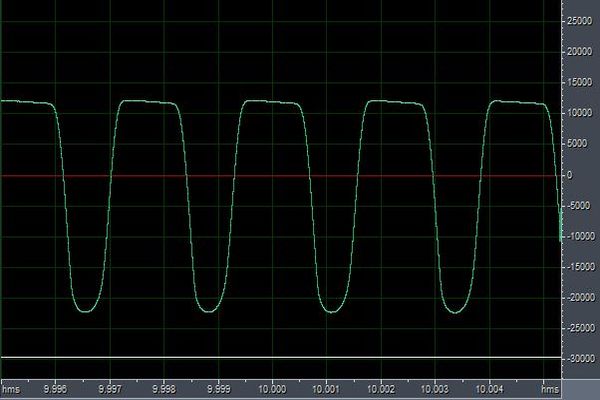
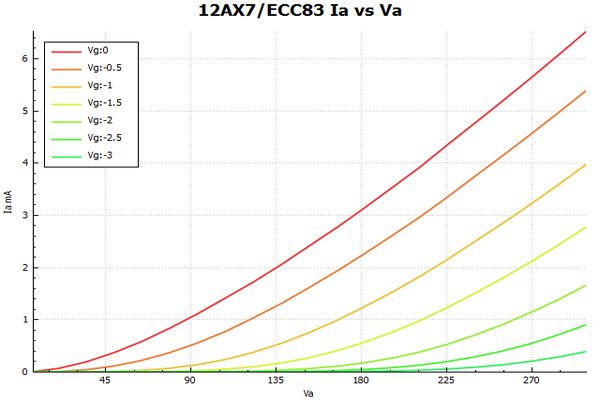
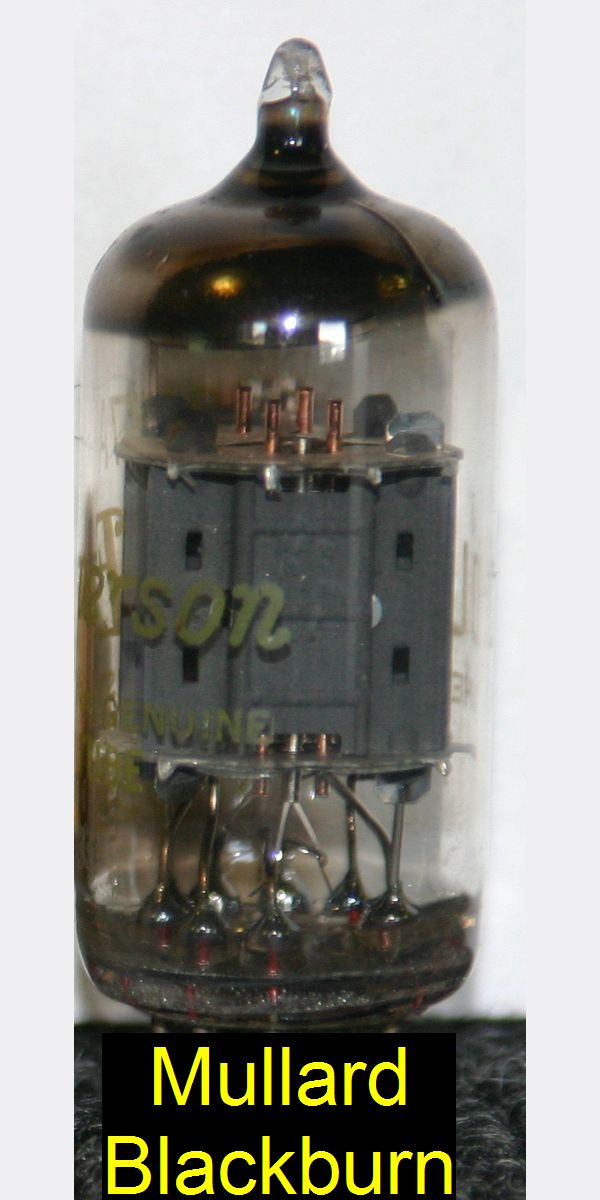
The question was how to interpret this data. There were subtle differences in the waveforms, with perhaps the Mullard Blackburn being the most obvious, an effect that seems to be due to the shape of the Ia/Va curves at higher grid voltages only gradually reducing the plate current. The other waveforms differ in the width of the low going pulse and in the sharpness of the corners at the top of the waveform. You can easily see why some with better hearing than I have often said that ‘ears are better than measuring instruments’. Personally I think both have equal value but it does require that the instruments are used to measure the right thing. This presents a problem when you are not sure what that is! Ears then guide us in the right direction.
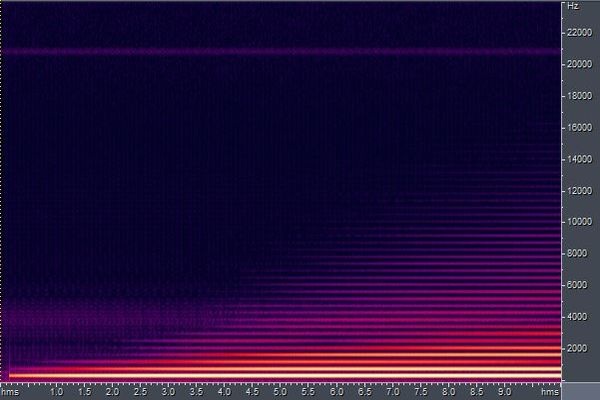
The spectrographs show a bit more going on in the harmonics as the gain increases, suggesting that the harmonic content has significant differences. Also the audio is different, but it is hard to compare qualitatively in the table above due to the length of the samples and because we can only listen to one at a time. I decided to do something about that. From each audio tube sample I took a single cycle of the 440Hz waveform from the end, where the the device was driven hardest into clipping. I then replicated that single sample until I had a clip about 750mS long for each of the sample devices. I then spliced all of these together in what, at least to my ear, was in order of increasing pleasantness. This is what the result of that looked and sounded like:
I also tabulated, in the same ‘by ear’ order, the minimums and maximums of each of these waveforms along with the magnitude of each harmonic up to the ninth. I had a hunch that the symmetry of the waveform might have something to do with the essential charactaristic of the timbre. I calculated this as max/(max-min). This is how it turned out:
Putting It All Together
| Harmonics dB | |||||||||||||
| A | A | E | A | C# | E | G | A | B | |||||
| Name | Grade (higher = better) | min | max | Symmetry | 1 | 2 | 3 | 4 | 5 | 6 | 7 | 8 | 9 |
| Mullard new production | 1 | 25160 | 11249 | 0.31 | -3.3 | -9.3 | -25.4 | -20.5 | -36.4 | -34.0 | -36.5 | -58.1 | -54.7 |
| Ei | 2 | 24635 | 11304 | 0.31 | -3.1 | -9.3 | -27.8 | -19.5 | -21.8 | -40.9 | -31.1 | -34.7 | -62.2 |
| JJ ECC83 | 3 | 24921 | 11573 | 0.32 | -3.0 | -9.4 | -28.9 | -19.7 | -22.5 | -40.5 | -34.2 | -38.0 | -53.6 |
| JJ ECC803 | 4 | 24226 | 12011 | 0.33 | -2.6 | -9.7 | -39.8 | -18.6 | -23.9 | -40.0 | -31.6 | -41.0 | -47.6 |
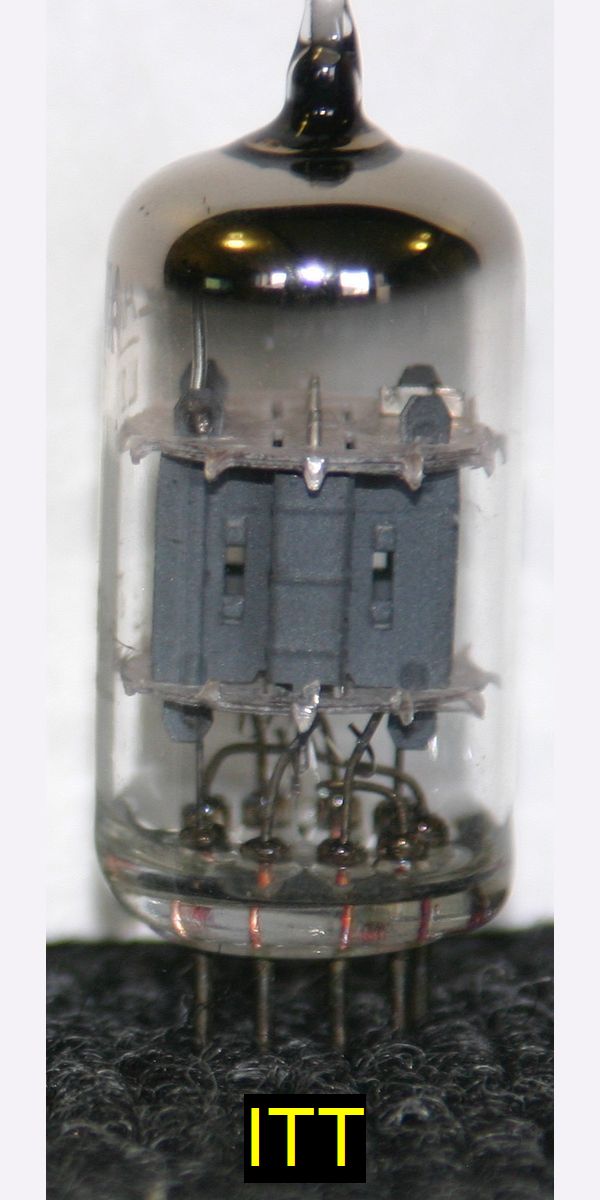
| ITT | 5 | 24521 | 12120 | 0.33 | -2.6 | -9.7 | -35.5 | -18.7 | -23.6 | -44.0 | -31.8 | -38.1 | -56.7 |
| Electro-Harmonix | 6 | 24398 | 12006 | 0.33 | -2.7 | -9.8 | -39.3 | -19.4 | -24.9 | -43.9 | -35.2 | -47.1 | -62.4 |
| RCA | 7 | 24290 | 12108 | 0.33 | -2.6 | -9.8 | -42.5 | -19.0 | -24.6 | -43.9 | -34.4 | -44.6 | -63.6 |
| General Electric | 8 | 23998 | 12342 | 0.34 | -2.4 | -10.1 | -34.4 | -18.8 | -26.1 | -36.5 | -33.7 | -47.7 | -49.5 |
| Realistic | 9 | 23408 | 12867 | 0.35 | -2.0 | -10.6 | -28.0 | -18.8 | -28.1 | -36.7 | -35.3 | -43.2 | -51.2 |
| Sino | 10 | 24614 | 12565 | 0.34 | -2.5 | -10.2 | -38.1 | -19.9 | -27.6 | -40.7 | -39.9 | -54.1 | -52.7 |
| Tung-Sol | 11 | 31139 | 16249 | 0.34 | -2.4 | -9.8 | -34.7 | -20.1 | -28.4 | -38.2 | -40.3 | -43.8 | -47.8 |
| Amperex | 12 | 31129 | 17562 | 0.36 | -1.9 | -11.0 | -26.0 | -19.7 | -32.1 | -37.9 | -43.8 | -55.6 | -46.6 |
| 6N2P (6H2?) | 13 | 31129 | 17827 | 0.36 | -2.0 | -11.7 | -26.4 | -22.7 | -39.2 | -41.8 | -49.9 | -47.2 | -50.9 |
| Sylvania | 14 | 25462 | 15221 | 0.37 | -2.1 | -12.8 | -34.4 | -32.0 | -37.9 | -41.0 | -46.6 | -50.2 | -52.8 |
| Sovtek 12AX7WC | 15 | 23953 | 16449 | 0.41 | -1.5 | -14.8 | -28.7 | -33.2 | -38.4 | -41.7 | -49.1 | -48.6 | -53.0 |
| Sovtek 12AX7LPS | 16 | 24668 | 14812 | 0.38 | -1.8 | -12.9 | -25.1 | -25.9 | -63.6 | -56.8 | -45.8 | -59.0 | -51.9 |
| Sovtek 12AX7WB | 17 | 23270 | 15487 | 0.4 | -1.3 | -14.4 | -23.2 | -26.1 | -41.8 | -52.4 | -47.7 | -47.5 | -53.4 |
| Sovtek 12AX7WA | 18 | 23807 | 15291 | 0.39 | -1.5 | -14.0 | -24.5 | -27.5 | -44.2 | -50.2 | -55.5 | -49.4 | -53.9 |
| Mullard Blackburn | 19 | 23583 | 15874 | 0.4 | -1.4 | -14.7 | -24.9 | -28.4 | -48.5 | -50.1 | -54.1 | -57.5 | -56.4 |
| Valvo | 20 | 23618 | 16286 | 0.41 | -1.3 | -15.8 | -24.6 | -34.2 | -61.1 | -45.8 | -56.8 | -60.0 | -62.7 |
| Telefunken | 21 | 23912 | 17283 | 0.42 | -1.3 | -17.7 | -25.7 | -50.3 | -49.3 | -50.6 | -57.8 | -55.7 | -69.6 |

Conclusion
In this case where clipping is involved the result is the opposite to the linear case from Part I above. The tube type does matter, and it’s not just a question of gain. The symmetry measure, despite it’s simplicity, is a very good but not perfect, guide to how a tube will sound when driven hard. The symmetry is a property of even harmonics so suggesting that these are a big factor in determining the quality of the tone. It’s also interesting to note that the three best sounding tubes are also the ones that seem to go for high prices viz. Mullard, Valvo and Telefunken. Also of note, the new production Mullard is nothing like the old ones, but please remember that the sample size here could not have been any smaller! So, if you are a manufactuer and are reading this and are horrified by my ranking then please send samples and I’ll test them for you. It might just have been an anomoly. The ultimate conclusion remains, type matters for clipping.
So what do I pick as the best all round performer based on price, microphonics, noise and clipping? The Sovtek 12AX7WC.
I do see the ‘Golden Ears’ crowd accused of being unscientific, and indeed they have had fun poked at them, but you can see here that they just might have been right all along when it come to clipping. Never forget, nothing trumps reliability, noise, microphonics and cost is always going to be a factor for most of us. Also, if you are considering new tubes for your preamp, you can be a little easier on yourself as only those driven hard or low noise need to be chosen with more care.
In the future: Part III – Power tubes